
Your data team isn't slow. They're buried under the same five questions.
One queue
Every team needs numbers, and they all wait in the same place: the data analyst's inbox.
Three days
Business teams wait three days for a number they needed yesterday, and end up deciding on instinct or a stale export.
The wrong fix
You've tried a BI tool. Metabase, Power BI, Looker. Built for the people who build dashboards, not the people who consume them.
Adoption stays low, the queue stays full. And none of them know what to do with a prediction.
Ask a question in plain language: Matr queries the warehouse, builds the chart, explains the result, and assembles it into a dashboard. Every result shows three views, chart, raw data, and SQL, so nothing is a black box.
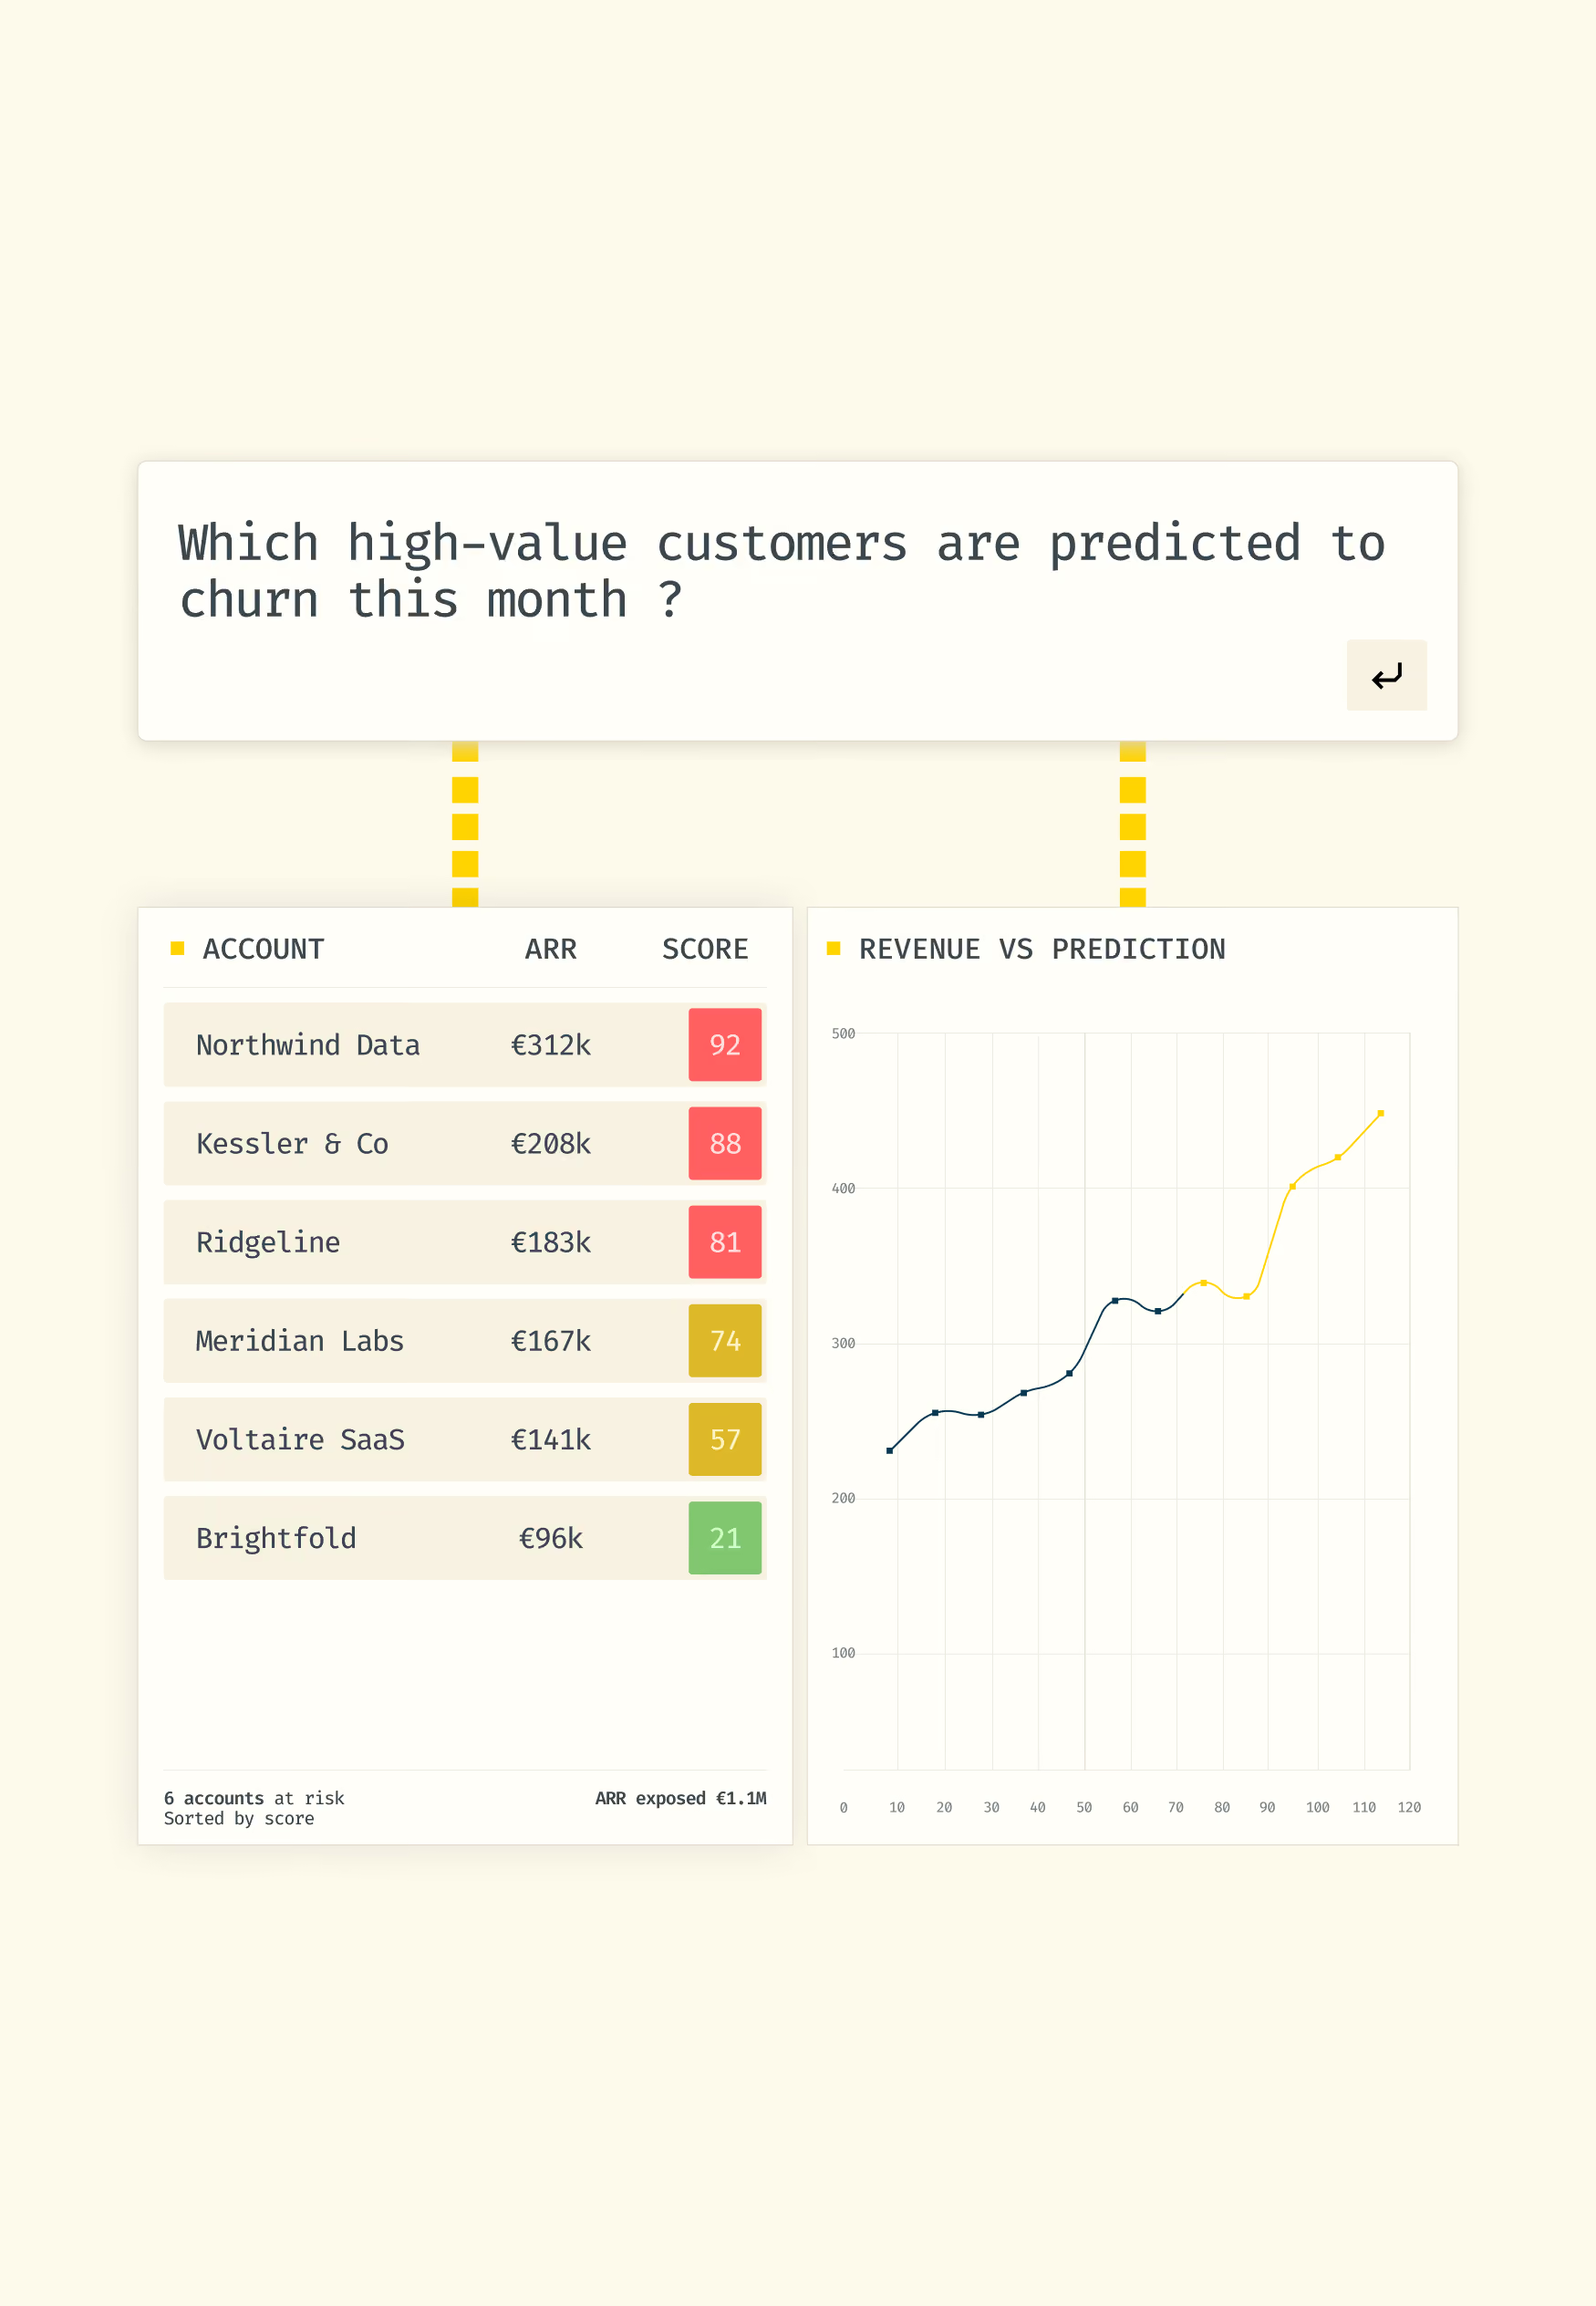
The difference: it works on any data. Pure BI metrics like revenue, funnel and KPIs. And the outputs of your ML models, churn scores, forecasts, segments. Both live in the same dashboard, because that's where the decision is made.
A prediction in a table is invisible. A prediction in a dashboard gets used.
This is what a standalone BI tool can't do. Your ML models produce churn scores, forecasts, and segments, but a score nobody sees changes nothing.
In Matr, those outputs are a queryable dataset like any other.
■ Put a churn score next to a revenue curve.
■ Ask, in plain language, "which high-value customers are predicted to churn this month?" and get a dashboard your business teams actually open.
■ Track a demand forecast against actual sales.
Opening data to more places doesn't mean losing control over it.
Most data apps break the moment they leave the warehouse. Metrics get redefined, logic gets copied, and two apps end up disagreeing on what churn means.
Apps built on Matr share one semantic layer. Same definitions, same logic, whether the app lives in your CRM, your Slack, or a customer-facing page.
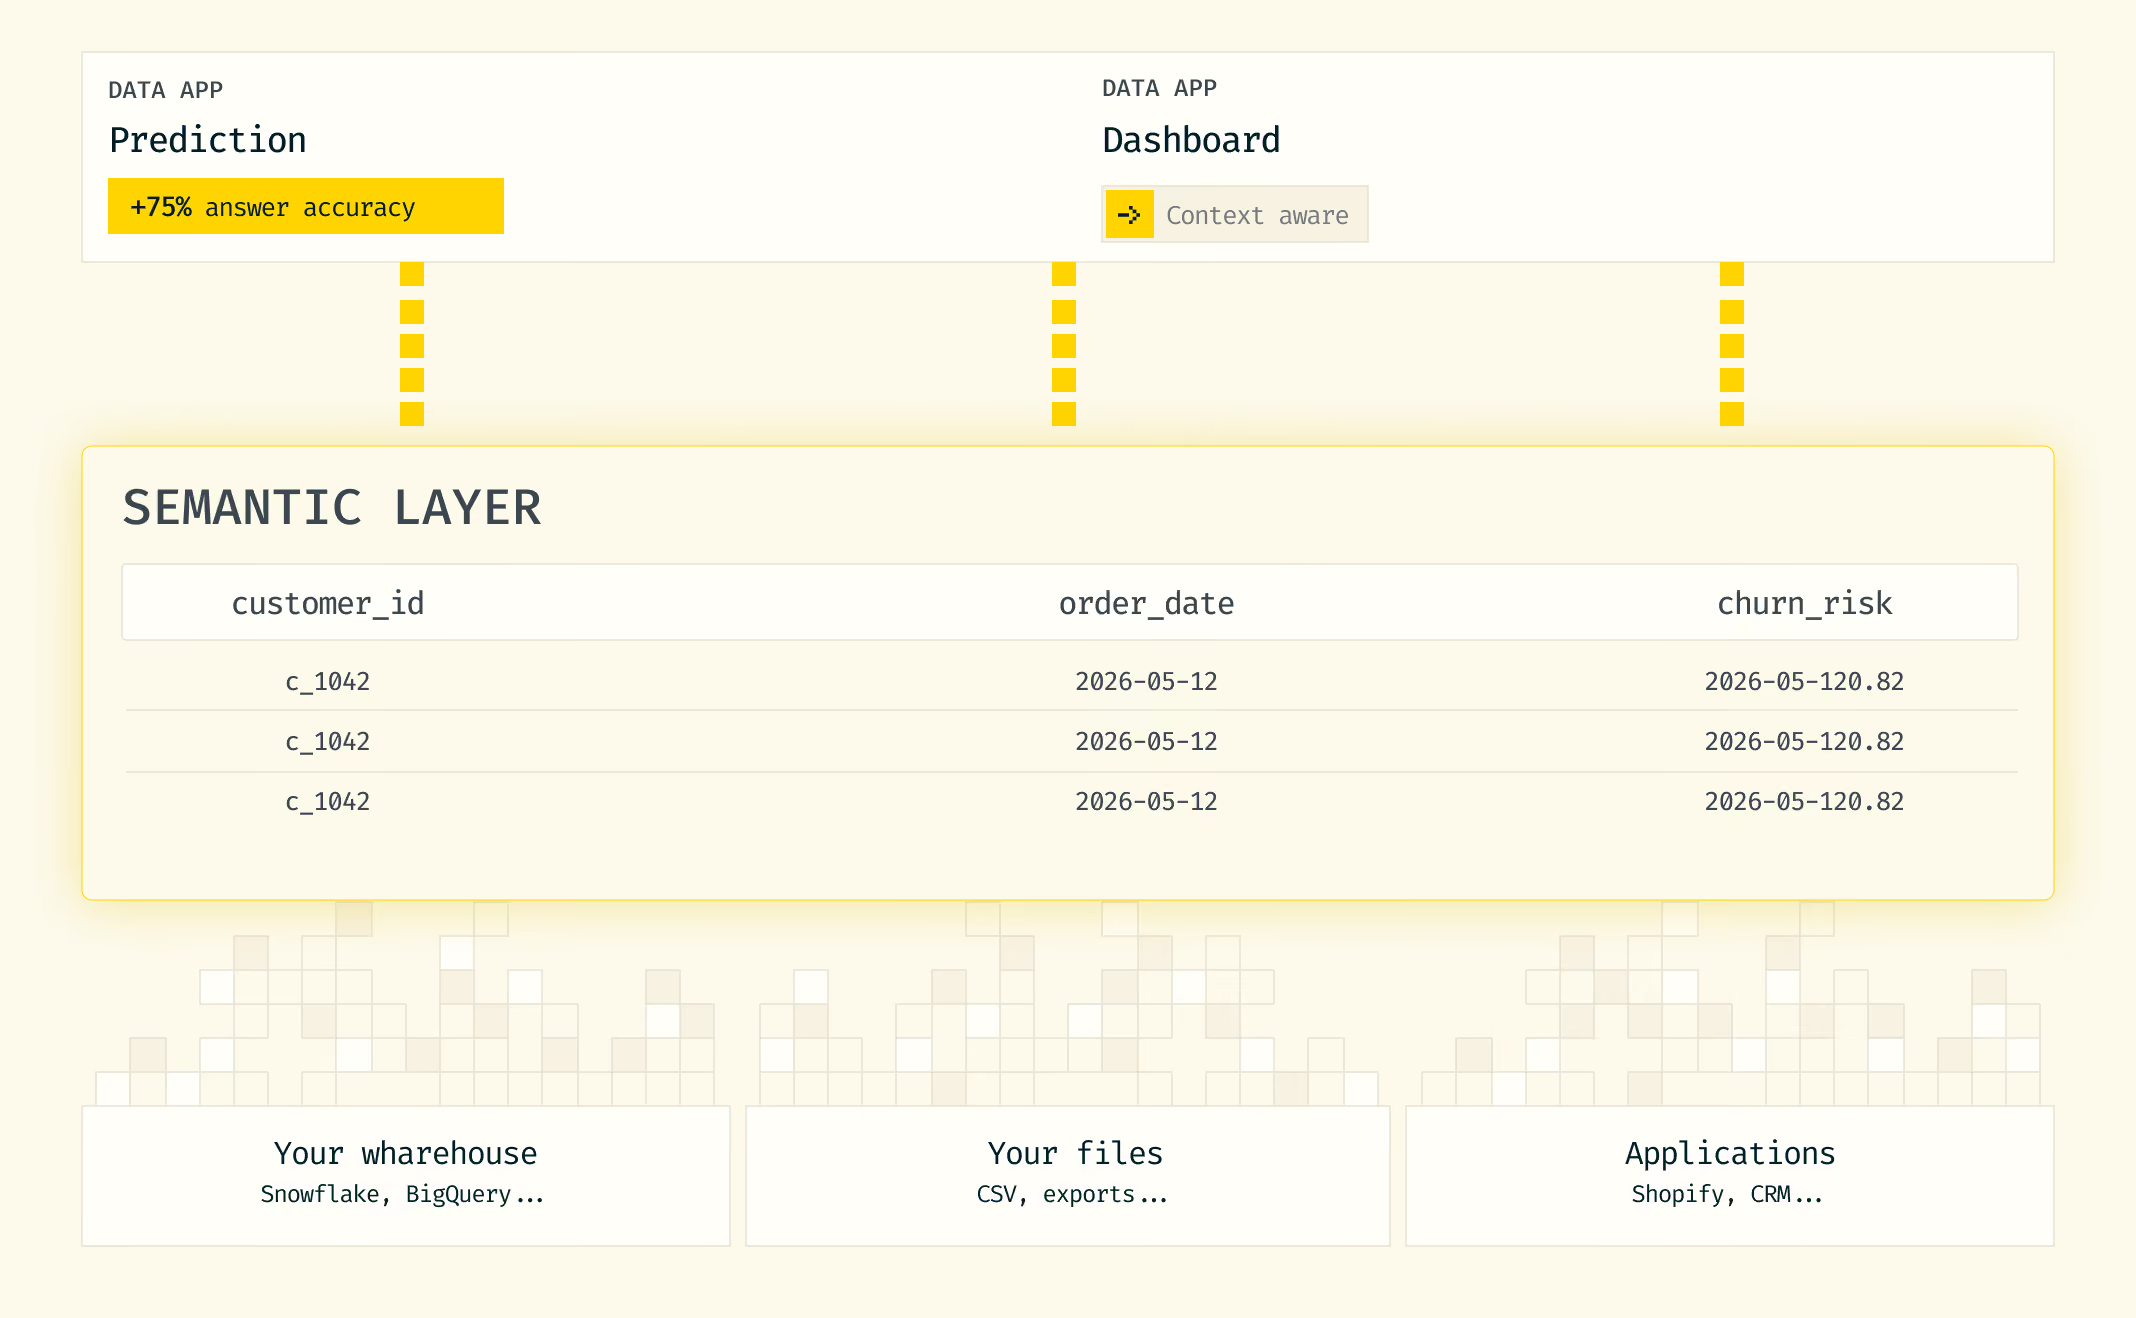
Matr fixes that at the platform level. rev_net_m3 is "Net Revenue (3-month)" whether the question comes from a dashboard, a Slack message, an API call, or an embedded widget in someone else's app.
Opening data to more places doesn't mean losing control over it.
A different approach.
Transparency on the division of responsibilities is itself a sign of seriousness. Here, without gray areas, who does what.
Matr
Traditional BI (Metabase, Power BI, ...)
Setup time
Hours
Weeks to months
Who builds dashboards
Data team builds, business users customizeData team builds, business users customize
Data team only
Natural language queries
Core feature, full NL to SQL
No, or basic
Semantic layer
Auto-generated
Manual config (LookML, dbt)
ML model outputs
Native, same dashboard as BI data
Separate tool, separate project
Data freshness
Live warehouse connection
Scheduled refresh
Questions we hear most.
Every month you spend building ML in-house is a month your competitors spend shipping predictions.
Do I need a data scientist to use Matr?
No. That's the whole point. Your data analyst describes the business question in natural language — Matr handles the ML pipeline.
What types of models can I build?
Classification (churn, scoring, segmentation), regression (revenue forecast, demand planning), and time-series forecasting. Matr selects the best approach based on your data.
How accurate are the models?
It depends on your data quality, but Matr shows you accuracy metrics, baseline comparison, and confidence scores so you can make an informed decision. Typical results: 75-95% accuracy on well-structured data.
Where does my data stay?
In your warehouse. Matr connects to your Snowflake, BigQuery, or PostgreSQL. No data is moved or duplicated.
Can I integrate predictions into my existing tools?
Yes. Via REST API, direct warehouse write-back, or scheduled exports. Predictions flow into your CRM, ERP, spreadsheet — wherever your team works.
What happens if the model's performance degrades?
Matr monitors model drift continuously. When performance drops below threshold, it flags the issue and can trigger automatic retraining.
For more questions, feel free to contact us