
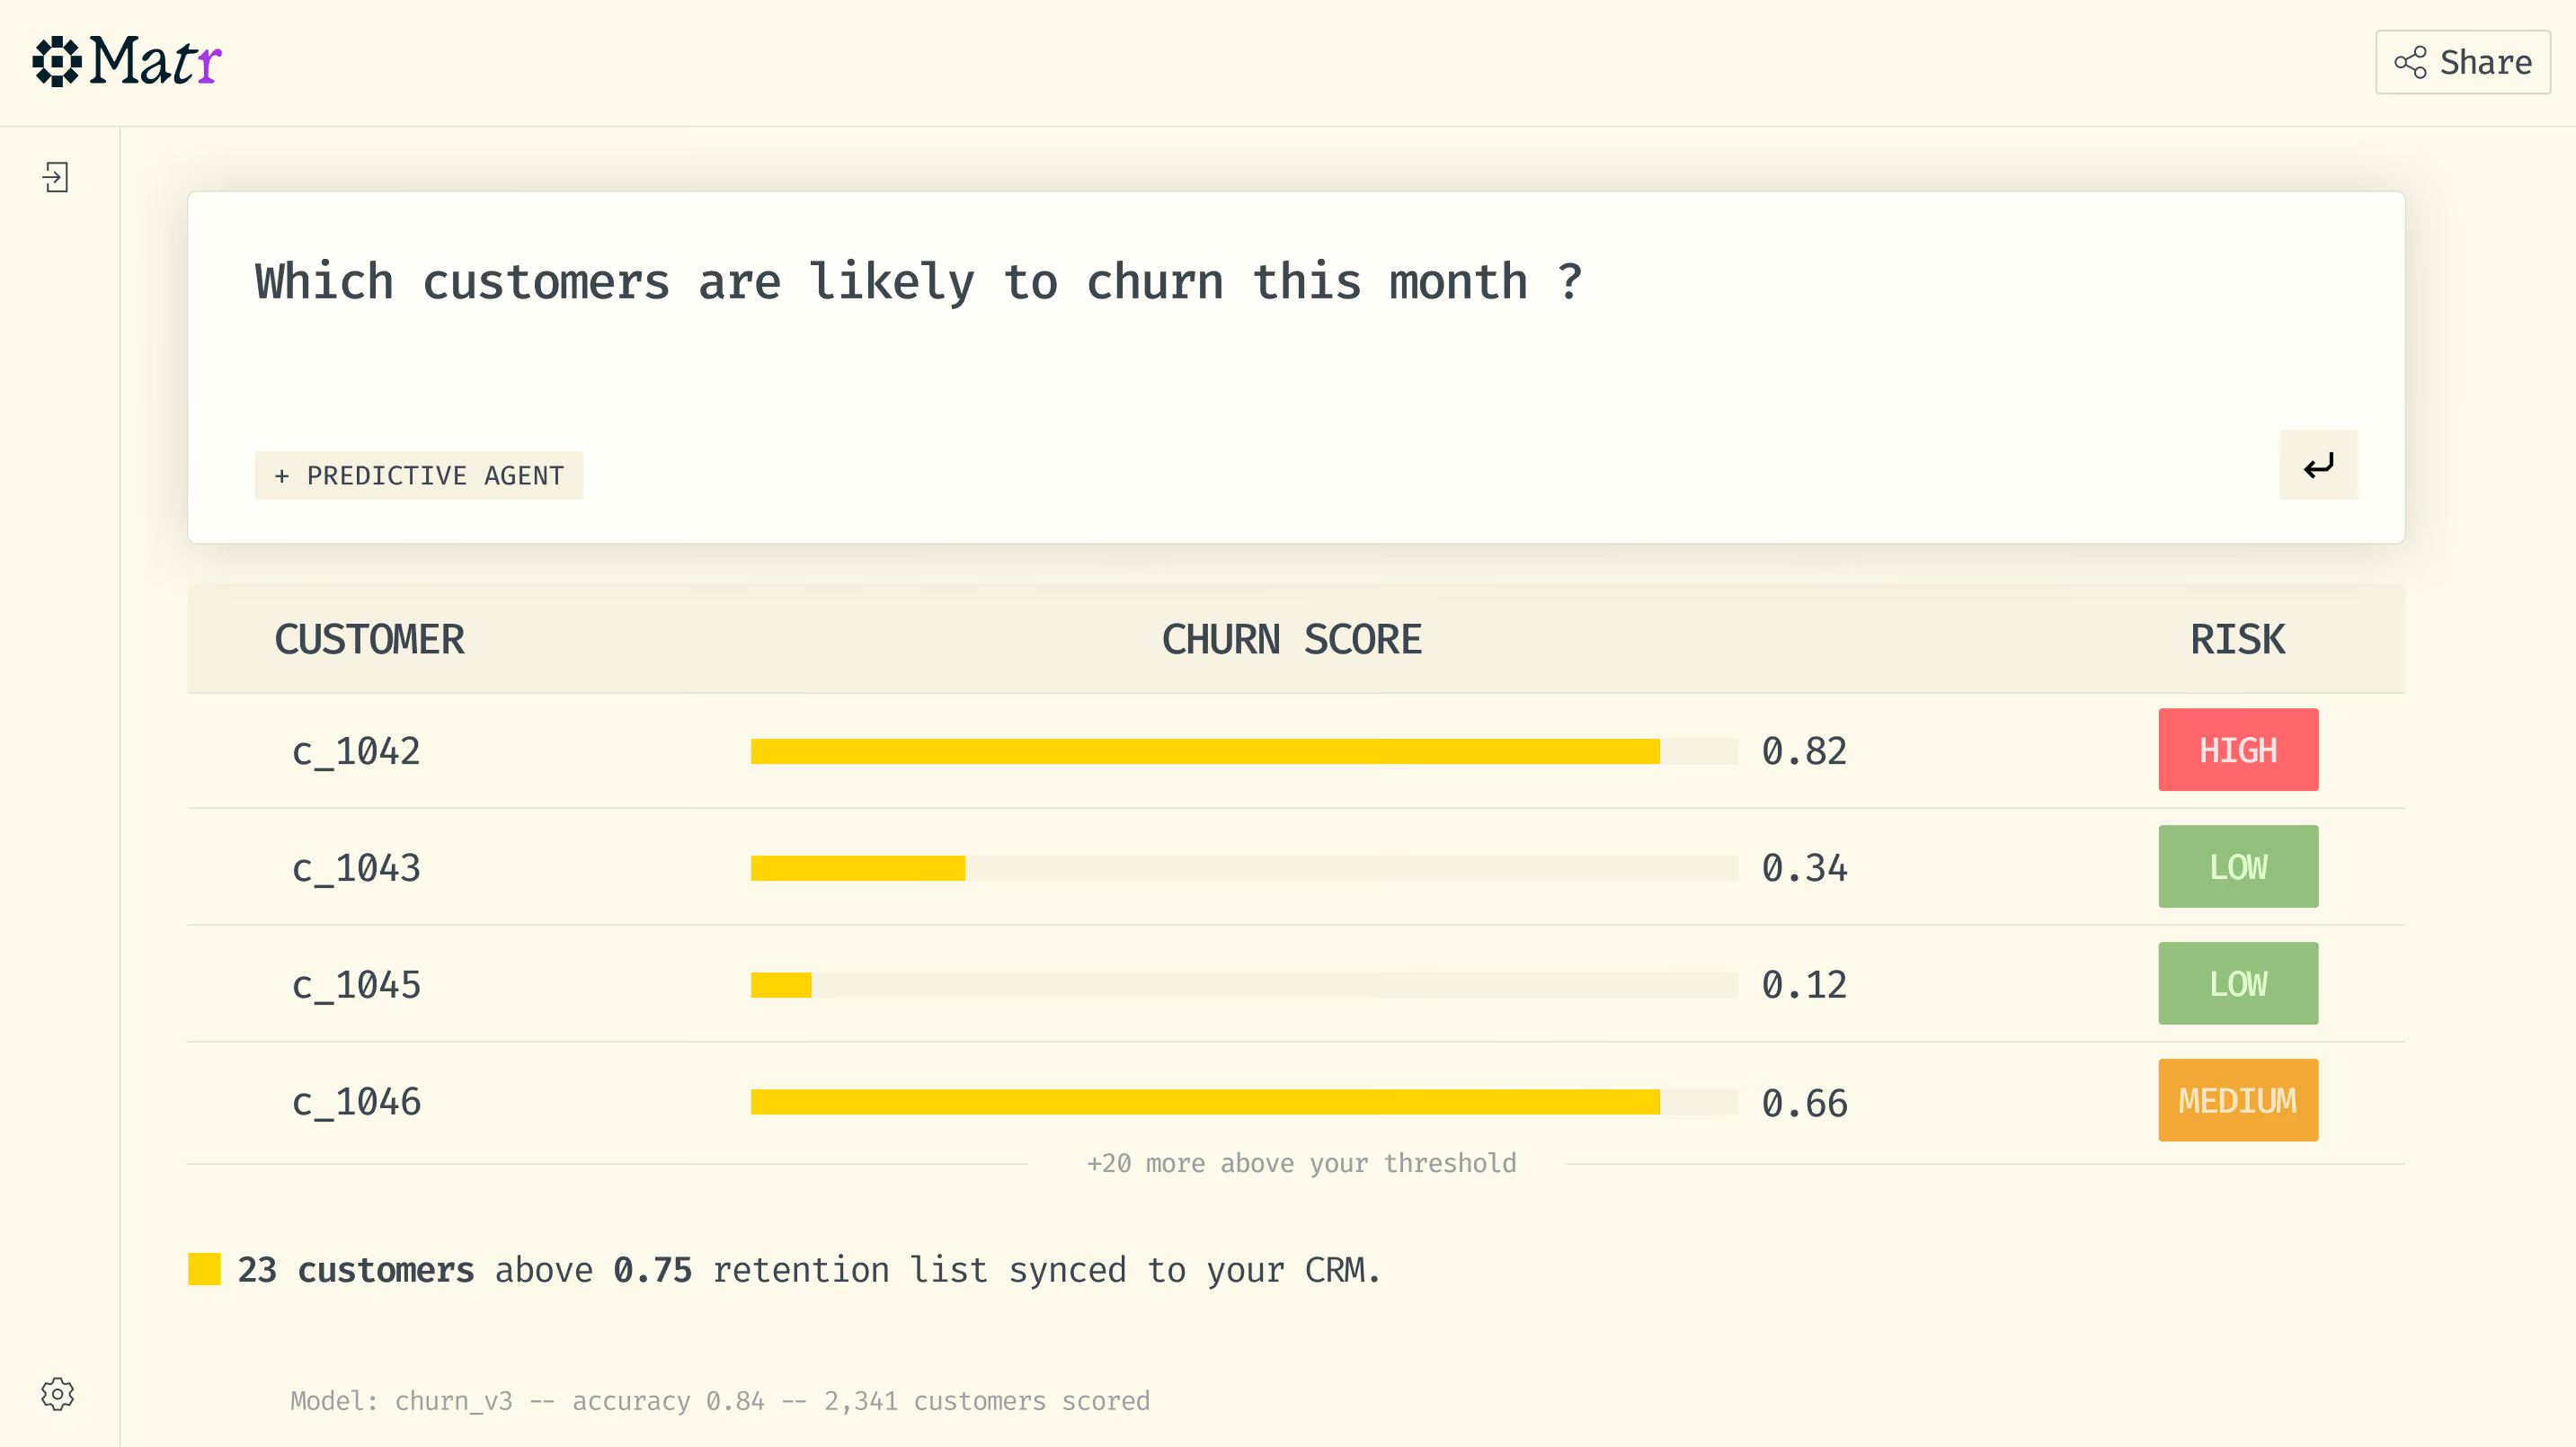
You can see churn. You'd like to see it coming.
You observe
Every month, your team opens the retention dashboard. Churn is calculated, lost customers identified. You comment, analyze, plan actions for next month.
You wait
Three weeks later, a churn propensity dashboard arrives. Valuable, but it describes a world that has already moved: the at-risk customers aren't quite the right ones anymore.
You're late
The problem isn't the absence of prediction. It's the absence of prediction at the right moment, on your timeline, directly accessible to your team.
Ce que c'est
Focus retention on high-value customers, not just all at-risk customers
Identify the behavioral segments most exposed to churn, tailor the message
Suggest the right reactivation product to each at-risk customer
Historique des vagues
Les études précédentes, pour suivre les évolutions d'une vague à l'autre.


Detection
« Et chez les cadres, ça donne quoi ? Et par rapport à l'an dernier ? »
You get the list, ranked by probability, with the signals that drove each prediction (drop in usage frequency, unopened recent emails, unsubscribe page visits).
Understanding
"Why is the Premium segment churning faster this quarter?"
Matr analyzes, cross-references variables, returns the main factors. Not a spreadsheet. An explanation, structured, actionable.
Action
"Which at-risk customers are most likely to respond to a 15% retention offer?"
You get the sub-segment to activate first, with projected response rate. The campaign builds itself from there.
Measurement
"What was the impact of last month's campaign on actual churn for the targeted customers?"
The model returns the gap between predicted churn and observed churn, with interpretation. You know what worked. You iterate.
another query tool.
Everyone
Natural language
Seconds
Questions en français, tris croisés pondérés, comparaison entre vagues.
Unlimited
Facteurs explicatifs d'une réponse.
Les questions qu'on nous pose.
Quels formats ?
CSV, Excel et SPSS. Import manuel ou dépôt automatique par SFTP.
Les données redressées sont-elles gérées ?
Oui. MatR applique la colonne de poids à chaque résultat.
Faut-il configurer chaque étude ?
Non. MatR lit la structure du fichier à l'import.
Nos clients peuvent-ils y accéder ?
Oui, chacun uniquement à ses études.